Memoization in the incident triage app
The same 200-incident app, data and controls: No memoization, Manual memoization, and React Compiler. These are local Chromium lab measurements, not production field telemetry. The compiler arm uses the experimental Oxc integration; results describe this integration and workload, not every React Compiler implementation.
Overview
Manual memoization remains effective in this app: no demonstrated selection-speed winner between compiler and manual, while compiler ships 5.26% more minified JavaScript.
| Metric | No memoization | Manual memoization | React Compiler |
|---|---|---|---|
| Initial assets, gzip (kB) | 78.15 | 78.28 (+0.14; +0.2%) | 83.09 (+4.95; +6.3%) |
| Full table readiness, median (ms) | 669.7 | 682.1 (+12.4; +1.9%) | 691.2 (+21.5; +3.2%) |
| Open detail DOM, median (ms) | 13.6 | 5.4 (-8.2; -60.3%) | 6.0 (-7.6; -55.9%) |
| Narrow query AP DOM, median (ms) | 35.8 | 29.5 (-6.3; -17.6%) | 29.3 (-6.5; -18.2%) |
| Clear query DOM, median (ms) | 62.2 | 55.6 (-6.6; -10.6%) | 55.2 (-7.0; -11.3%) |
Parentheses show absolute change and percentage against No memoization: negative means fewer bytes or less time, positive means more. Percentages use the unrounded report values, not rounded display cells. A zero reference gives n/a. Each row is its own endpoint; different workloads and protocols are never pooled into a score or ranking.
Manual optimization has lower bundle cost in this workload. Median selection-to-detail DOM at 4x CPU slowdown: 13.6 ms (No memoization); 5.4 ms (Manual memoization); 6 ms (React Compiler). These descriptive timings do not establish a repeatable speed winner. They do not establish equivalent responsiveness, identical memory behavior, or guaranteed gains in every scenario. Compare load, selection and query filtering separately; fewer render-work events do not by themselves demonstrate lower latency.
Six local load repetitions, three Lighthouse audits and twenty warmed trials per interaction in one Chromium process are advisory, not statistical proof or real-user evidence. Paint opportunity is not a guaranteed presentation timestamp. Render-work events use internal React 19.3.0 profiling fiber flags, not a public API; revalidate after upgrades. The Oxc compiler integration is experimental.
Page load
Initial-load production bytes
Normal production builds only. All sizes use decimal kB (1 kB = 1,000 bytes); exact bytes remain in comparison.json. Parentheses are differences against No memoization.
| Metric | No memoization | Manual memoization | React Compiler |
|---|---|---|---|
| JS raw (kB) | 243.00 | 243.64 (+0.63; +0.3%) | 256.45 (+13.45; +5.5%) |
| JS gzip (kB) | 74.66 | 74.80 (+0.14; +0.2%) | 79.61 (+4.95; +6.6%) |
| CSS raw (kB) | 12.72 | 12.72 (0.00; 0.0%) | 12.72 (0.00; 0.0%) |
| CSS gzip (kB) | 3.49 | 3.49 (0.00; 0.0%) | 3.49 (0.00; 0.0%) |
| TOTAL raw (kB) | 255.72 | 256.35 (+0.63; +0.2%) | 269.17 (+13.45; +5.3%) |
| TOTAL gzip (kB) | 78.15 | 78.28 (+0.14; +0.2%) | 83.09 (+4.95; +6.3%) |
Manifest entry JS, static imports, and attached CSS counted once per file. Source maps, dynamic imports, and profile builds excluded. Bundle bytes do not measure parse time or interaction latency. Separately loaded chunks: No memoization: none; Manual memoization: none; React Compiler: none.
User-perceived load time (UPLT)
UPLT is navigation start to the full 200-row incident table completing two animation frames (a paint opportunity). Fresh isolated contexts, normal production builds, 4x CDP CPU slowdown, six runs covering all six app-order permutations, with each app in each position twice; no network throttling. This is a lab readiness proxy, not a Core Web Vital, guaranteed paint or an input-response metric.
| Metric | No memoization | Manual memoization | React Compiler |
|---|---|---|---|
| Median readiness (ms) | 669.7 | 682.1 (+12.4; +1.9%) | 691.2 (+21.5; +3.2%) |
| Run 1 / 2 / 3 / 4 / 5 / 6 (ms) | 686.9 / 704.1 / 668.9 / 668.5 / 670.5 / 646.2 | 656.2 / 694.9 / 701.5 / 669.3 / 664.2 / 711.7 | 693.3 / 689 / 653.2 / 697.1 / 669.1 / 726.6 |
Load memory (normal production builds)
Separate memory-only loads: six repetitions per app, all six app orders, a fresh Chromium browser and context for each load, cache disabled, 1440 x 900 viewport and 4x CPU slowdown. Readiness is the full 200-row table followed by two animation-frame callbacks. No React profiling build, DevTools hook, CPU sampling, or forced GC runs during the load window; memory polling is not added to the existing load/interaction latency runs.
JS heap used is CDP Runtime.getHeapUsage.usedSize (V8 used heap). Embedder heap used is embedderHeapUsedSize (the embedder's garbage-collected heap, including Blink-managed objects); it is not all native/DOM memory or total tab/process memory. CDP reports the corresponding isolate, not just React or a single execution context. Allocated JS heap (totalSize) and array-buffer/external-string backing storage (backingStorageSize) are retained separately in the raw data, not added into a claimed memory total.
| Metric | Observation | No memoization MiB, median [min, max] | Manual memoization MiB, median [min, max] | React Compiler MiB, median [min, max] | Manual vs no memoization | Compiler vs no memoization | Compiler vs manual |
|---|---|---|---|---|---|---|---|
| JS heap used | Ready, before forced GC | 3.229 [3.218, 3.236] | 3.290 [3.280, 3.313] | 3.686 [3.673, 3.691] | +1.91% | +14.16% | +12.02% |
| JS heap used | Sampled load-window peak | 3.229 [3.218, 3.236] | 3.290 [3.280, 3.313] | 3.686 [3.673, 3.691] | +1.91% | +14.16% | +12.02% |
| JS heap used | Ready, after forced GC | 2.590 [2.590, 2.590] | 2.641 [2.640, 2.641] | 3.019 [3.019, 3.019] | +1.94% | +16.55% | +14.33% |
| Embedder heap used | Ready, before forced GC | 13.656 [13.656, 13.656] | 13.656 [13.656, 13.656] | 13.656 [13.656, 13.656] | 0.00% | 0.00% | 0.00% |
| Embedder heap used | Sampled load-window peak | 13.656 [13.656, 13.656] | 13.656 [13.656, 13.656] | 13.656 [13.656, 13.656] | 0.00% | 0.00% | 0.00% |
| Embedder heap used | Ready, after forced GC | 7.200 [7.200, 7.200] | 7.200 [7.199, 7.200] | 7.200 [7.199, 7.200] | 0.00% | 0.00% | 0.00% |
Main percentages compare unrounded medians against No memoization; the final compiler-versus-manual column uses manual as its reference. Negative means less memory, positive means more. Min/max show the six runs, not confidence intervals. No memory winner or statistical significance is inferred from this small local sample.
Samples use Runtime.getHeapUsage with a requested 20 ms pause after each response. CDP scheduling and main-thread work can delay samples; timestamps bracket each request in the raw data. The sampled peak is the largest observed counter from navigation start through the readiness snapshot, not the true allocation peak; independent counter maxima need not occur together. Polling adds overhead, and natural GC can occur before any sample. Ready/pre-forced-GC values therefore include GC-timing noise, not just live retained objects.
Observed coverage: 3-3 load-window samples per run, plus the readiness snapshot. The longest load-window/readiness request spanned 387.4 ms; the largest readiness-to-snapshot completion lag was 5.5 ms. Sparse samples cannot rule out larger transient allocations between observations.
The post-GC snapshot follows HeapProfiler.collectGarbage and is a separate retained-memory diagnostic, not a cold-load peak or a leak test. The blank-page snapshot is preserved for context but is not subtracted: navigation can change the isolate. These are cold browser/cache runs, not cold OS/disk caches or real-user device measurements. Raw load-memory samples include all counters, request timestamps, run order and readiness observations. Differences are observations for this workload, not proof of a compiler-caused reduction.
Lighthouse (mobile lab)
Lighthouse 12.8.2, mobile preset with simulate throttling, normal builds. Three fresh Chrome launches per app, alternating order. Scores are 0-100, timings are milliseconds and CLS is unitless. Median metrics are advisory; this protocol is separate from the desktop 4x CDP setup. No memoization raw audit / Manual memoization raw audit / React Compiler raw audit.
| Metric | No memoization | Manual memoization | React Compiler |
|---|---|---|---|
| Performance score | 100.0 | 100.0 | 100.0 |
| Accessibility score | 95.0 | 95.0 | 95.0 |
| FCP (ms) | 1355.0 | 1356.6 | 1356.2 |
| LCP (ms) | 1355.0 | 1356.6 | 1356.2 |
| TBT (ms) | 80.0 | 78.0 | 86.0 |
| Speed Index (ms) | 1355.0 | 1356.6 | 1356.2 |
| CLS | 0.000 | 0.000 | 0.000 |
| Time to Interactive (ms) | 1485.0 | 1482.9 | 1489.8 |
Row selection
Path: Platform queue, 67 visible incidents, no detail selected, open INC-0001. Closing the detail is an untimed reset, not a measured endpoint.
Selection responsiveness (normal production builds)
One open/close warm-up followed by 20 warmed trials per app, isolated contexts, rotated app order and 4x CDP CPU slowdown. Timing starts in the browser click handler and stops at the correct detail DOM mutation, then at two animation-frame callbacks. The latter is a paint opportunity, not guaranteed presentation or INP. Playwright latency and React profiling overhead are excluded. Per-trial results remain in selection-latency.json.
| Metric | No memoization | Manual memoization | React Compiler |
|---|---|---|---|
| DOM median (ms) | 13.6 | 5.4 | 6.0 |
| DOM p90 (ms) | 18.2 | 7.6 | 8.8 |
| Two-frame opportunity median (ms) | 33.7 | 24.2 | 26.5 |
| Two-frame opportunity p90 (ms) | 42.7 | 32.8 | 29.7 |
Selection component work (profiling builds)
Same selection state and target, separate native-speed profiling builds, one warm-up and medians of three rotated repetitions. Render-work events count completed update work, not milliseconds or DOM mutations. Counts and timings come from different runs and are not directly interchangeable.
| Metric | No memoization | Manual memoization | React Compiler |
|---|---|---|---|
| Whole-app commits | 1 | 1 | 1 |
| Queue render-work events | 0 | 0 | 0 |
| Row render-work events | 67 | 1 | 67 |
| Open-button render-work events | 67 | 0 | 0 |
| Favorite-button render-work events | 67 | 0 | 0 |
| Row mounts (not update events) | 0 | 0 | 0 |
| Open-button mounts | 0 | 0 | 0 |
| Favorite-button mounts | 0 | 0 | 0 |
Selection inclusive Profiler durations
ACTUAL is React's measured subtree render duration; BASE is an estimate, not an unoptimized comparison run. These are per-run callback medians, not end-to-end selection time. See the expanded methodology below.
| Metric | No memoization | Manual memoization | React Compiler |
|---|---|---|---|
| root ACTUAL (ms) | 3.4 | 1.0 | 1.5 |
| root BASE estimate (ms) | 3.8 | 9.5 | 6.6 |
| shell ACTUAL (ms) | 3.4 | 0.9 | 1.5 |
| shell BASE estimate (ms) | 3.3 | 8.9 | 5.8 |
| toolbar ACTUAL (ms) | not observed | not observed | not observed |
| toolbar BASE estimate (ms) | not observed | not observed | not observed |
| list ACTUAL (ms) | 2.6 | 0.3 | 0.9 |
| list BASE estimate (ms) | 2.2 | 7.2 | 3.6 |
| detail ACTUAL (ms) | 0.5 | 0.7 | 0.6 |
| detail BASE estimate (ms) | 0.2 | 0.4 | 0.3 |
| rows ACTUAL (ms) | 0.0 | 0.0 | 0.0 |
| rows BASE estimate (ms) | 0.0 | 0.0 | 0.0 |
| queueItems ACTUAL (ms) | not observed | not observed | not observed |
| queueItems BASE estimate (ms) | not observed | not observed | not observed |
| openButtons ACTUAL (ms) | 0.0 | 0.0 | not observed |
| openButtons BASE estimate (ms) | 0.0 | 0.1 | not observed |
| favoriteButtons ACTUAL (ms) | 0.0 | 0.0 | not observed |
| favoriteButtons BASE estimate (ms) | 0.0 | 0.1 | not observed |
Why equal row counts do not mean equal work
Selection update events: No memoization: 67 rows, 67 open buttons, 67 favorite buttons; Manual memoization: 1 rows, 0 open buttons, 0 favorite buttons; React Compiler: 67 rows, 0 open buttons, 0 favorite buttons. Compiler and baseline record the same number of row events here, but the compiler records fewer child-button events. Equal row counts do not mean equal CPU cost or equal DOM work.
In this Oxc output, IncidentList caches the whole mapped result against incidents and selectedId. Invalidating that cache runs the map again. IncidentRow also caches child JSX internally, while the manual outer memo boundary can skip entering an unchanged row. This is a difference in optimization boundaries, not a general inability of React Compiler to achieve memo-like bailouts through caller-side JSX caching.
This explanation is scoped to oxc-transform-react 0.145.0 and the inspected measured output. Compiler App snapshot / Manual App snapshot are post-transform, pre-bundle inspection artifacts; later bundling and minification can change shipped code.
Compiler: list-wide cache
if ($[1] !== incidents || $[2] !== selectedId) {
    let t3;
    if ($[4] !== selectedId) {
      t3 = (incident) =>
        /* @__PURE__ */ _jsx(
          Profiled,
          {
            id: `row:${incident.id}`,
            children: /* @__PURE__ */ _jsx(IncidentRow, {
              incident,
              selected: selectedId === incident.id,
            }),
          },
          incident.id,
        );
      $[4] = selectedId;
      $[5] = t3;
    } else {
      t3 = $[5];
    }
    t2 = incidents.map(t3);
    $[1] = incidents;
    $[2] = selectedId;
    $[3] = t2;
  } else {
    t2 = $[3];
  }
Compiler: cached child JSX inside IncidentRow
if (
    $[6] !== incident.id ||
    $[7] !== incident.severity ||
    $[8] !== incident.title ||
    $[9] !== openIncident
  ) {
    t5 = /* @__PURE__ */ _jsx(OpenIncidentButton, {
      id: incident.id,
      title: incident.title,
      severity: incident.severity,
      onOpen: openIncident,
    });
    $[6] = incident.id;
    $[7] = incident.severity;
    $[8] = incident.title;
    $[9] = openIncident;
    $[10] = t5;
  } else {
    t5 = $[10];
  }
Manual: outer row boundary (ordinary builds define the row-memo flag as true)
const IncidentRow = __ROW_MEMO_ENABLED__ ? memo(IncidentRowImpl) : IncidentRowImpl;
Query filtering
Path: All incidents, 200 rows, All statuses, newest sort and no selected detail. Type A, then AP, then API; clear once to restore the initial list. This path runs independently of selection and favorite edits. Expected rows: 200 / 34 / 34 / 200.
Filtering responsiveness (normal production builds)
One complete warm-up, then 20 warmed cycles per app with rotated order, isolated contexts and 4x CDP CPU slowdown. Timing starts at the native input event before the React handler. AP and clear stop at the correct result-list mutation, followed by two frame callbacks. A and API leave result IDs unchanged: no result-DOM endpoint exists, so DOM timing is null, not zero; their input-to-two-frame opportunity still measures response work. Every endpoint verifies the exact ordered IDs and input value. This synchronous workload has no debounce or pending async search.
Typing uses at least 100 ms pacing between input steps; pacing, Playwright waits, setup and reset are excluded from the measured endpoints. Clearing is one input change, not repeated backspace. Medians and nearest-rank p90 are computed per step across 20 cycles; they are not summed into a workflow total. Raw typed-filtering trials.
| Metric | No memoization | Manual memoization | React Compiler |
|---|---|---|---|
| type A / DOM median (ms) | no result change | no result change | no result change |
| type A / DOM p90 (ms) | no result change | no result change | no result change |
| type A / Two-frame opportunity median (ms) | 54.8 | 33.4 | 32.3 |
| type A / Two-frame opportunity p90 (ms) | 62.7 | 39.2 | 36.1 |
| type AP / DOM median (ms) | 35.8 | 29.5 | 29.3 |
| type AP / DOM p90 (ms) | 44.0 | 35.0 | 31.0 |
| type AP / Two-frame opportunity median (ms) | 62.3 | 53.9 | 54.1 |
| type AP / Two-frame opportunity p90 (ms) | 69.1 | 62.1 | 58.4 |
| type API / DOM median (ms) | no result change | no result change | no result change |
| type API / DOM p90 (ms) | no result change | no result change | no result change |
| type API / Two-frame opportunity median (ms) | 18.9 | 14.0 | 13.9 |
| type API / Two-frame opportunity p90 (ms) | 21.5 | 26.9 | 28.3 |
| clear query / DOM median (ms) | 62.2 | 55.6 | 55.2 |
| clear query / DOM p90 (ms) | 68.7 | 67.2 | 63.3 |
| clear query / Two-frame opportunity median (ms) | 243.9 | 238.6 | 231.5 |
| clear query / Two-frame opportunity p90 (ms) | 349.5 | 254.9 | 296.5 |
Filtering component work (profiling builds)
Fresh default state per profiling run, one warm-up and three native-speed repetitions with rotated order. Clearing remounts 166 previously removed rows; mounts are shown separately and are not counted as render-work update events. Inclusive ACTUAL/BASE callback medians below have diagnostic overhead, not production response timing.
type A (200 rows)
| Metric | No memoization | Manual memoization | React Compiler |
|---|---|---|---|
| Whole-app commits | 1 | 1 | 1 |
| Queue render-work events | 4 | 0 | 0 |
| Row render-work events | 200 | 0 | 200 |
| Open-button render-work events | 200 | 0 | 0 |
| Favorite-button render-work events | 200 | 0 | 0 |
| Row mounts (not update events) | 0 | 0 | 0 |
| Open-button mounts | 0 | 0 | 0 |
| Favorite-button mounts | 0 | 0 | 0 |
| Metric | No memoization | Manual memoization | React Compiler |
|---|---|---|---|
| root ACTUAL (ms) | 13.2 | 2.9 | 3.7 |
| root BASE estimate (ms) | 12.6 | 12.9 | 15.3 |
| toolbar ACTUAL (ms) | 0.3 | 0.4 | 0.0 |
| toolbar BASE estimate (ms) | 0.2 | 0.4 | 0.5 |
| list ACTUAL (ms) | 11.7 | 1.2 | 2.7 |
| list BASE estimate (ms) | 10.5 | 10.0 | 11.6 |
type AP (34 rows)
| Metric | No memoization | Manual memoization | React Compiler |
|---|---|---|---|
| Whole-app commits | 1 | 1 | 1 |
| Queue render-work events | 4 | 0 | 0 |
| Row render-work events | 34 | 0 | 34 |
| Open-button render-work events | 34 | 0 | 0 |
| Favorite-button render-work events | 34 | 0 | 0 |
| Row mounts (not update events) | 0 | 0 | 0 |
| Open-button mounts | 0 | 0 | 0 |
| Favorite-button mounts | 0 | 0 | 0 |
| Metric | No memoization | Manual memoization | React Compiler |
|---|---|---|---|
| root ACTUAL (ms) | 2.5 | 1.1 | 1.2 |
| root BASE estimate (ms) | 2.7 | 4.1 | 4.9 |
| toolbar ACTUAL (ms) | 0.2 | 0.3 | 0.1 |
| toolbar BASE estimate (ms) | 0.2 | 0.3 | 0.4 |
| list ACTUAL (ms) | 1.6 | 0.4 | 0.7 |
| list BASE estimate (ms) | 1.5 | 2.1 | 1.8 |
type API (34 rows)
| Metric | No memoization | Manual memoization | React Compiler |
|---|---|---|---|
| Whole-app commits | 1 | 1 | 1 |
| Queue render-work events | 4 | 0 | 0 |
| Row render-work events | 34 | 0 | 34 |
| Open-button render-work events | 34 | 0 | 0 |
| Favorite-button render-work events | 34 | 0 | 0 |
| Row mounts (not update events) | 0 | 0 | 0 |
| Open-button mounts | 0 | 0 | 0 |
| Favorite-button mounts | 0 | 0 | 0 |
| Metric | No memoization | Manual memoization | React Compiler |
|---|---|---|---|
| root ACTUAL (ms) | 2.6 | 1.1 | 0.7 |
| root BASE estimate (ms) | 2.6 | 4.0 | 4.3 |
| toolbar ACTUAL (ms) | 0.2 | 0.4 | 0.1 |
| toolbar BASE estimate (ms) | 0.2 | 0.4 | 0.4 |
| list ACTUAL (ms) | 1.8 | 0.2 | 0.4 |
| list BASE estimate (ms) | 1.3 | 1.9 | 1.5 |
clear query (200 rows)
| Metric | No memoization | Manual memoization | React Compiler |
|---|---|---|---|
| Whole-app commits | 1 | 1 | 1 |
| Queue render-work events | 4 | 0 | 0 |
| Row render-work events | 34 | 0 | 34 |
| Open-button render-work events | 34 | 0 | 0 |
| Favorite-button render-work events | 34 | 0 | 0 |
| Row mounts (not update events) | 166 | 166 | 166 |
| Open-button mounts | 166 | 166 | 166 |
| Favorite-button mounts | 166 | 166 | 166 |
| Metric | No memoization | Manual memoization | React Compiler |
|---|---|---|---|
| root ACTUAL (ms) | 18.3 | 17.8 | 17.6 |
| root BASE estimate (ms) | 7.7 | 8.9 | 10.8 |
| toolbar ACTUAL (ms) | 0.1 | 0.3 | 0.1 |
| toolbar BASE estimate (ms) | 0.1 | 0.3 | 0.3 |
| list ACTUAL (ms) | 17.8 | 17.2 | 17.4 |
| list BASE estimate (ms) | 6.6 | 6.9 | 8.0 |
Additional evidence
Component work and committed updates (median of 3 runs)
Additional actions come from the existing stateful workflow: mark all notifications read, Platform queue, selection, favorite, bulk search INC-0001, status filter, sort/reset, resolve. The inbox is opened before and closed after the measured notification acknowledgment. The bulk search is not the independent typed-query benchmark above; sort/reset combines four operations. No production latency is claimed for these additional actions.
read notifications
| Metric | No memoization | Manual memoization | React Compiler |
|---|---|---|---|
| Whole-app commits | 1 | 1 | 1 |
| Queue render-work events | 0 | 0 | 0 |
| Row render-work events | 0 | 0 | 0 |
| Open-button render-work events | 0 | 0 | 0 |
| Favorite-button render-work events | 0 | 0 | 0 |
| Row mounts (not update events) | 0 | 0 | 0 |
| Open-button mounts | 0 | 0 | 0 |
| Favorite-button mounts | 0 | 0 | 0 |
switch queue
| Metric | No memoization | Manual memoization | React Compiler |
|---|---|---|---|
| Whole-app commits | 1 | 1 | 1 |
| Queue render-work events | 4 | 2 | 4 |
| Row render-work events | 67 | 0 | 67 |
| Open-button render-work events | 67 | 0 | 0 |
| Favorite-button render-work events | 67 | 0 | 0 |
| Row mounts (not update events) | 0 | 0 | 0 |
| Open-button mounts | 0 | 0 | 0 |
| Favorite-button mounts | 0 | 0 | 0 |
favorite incident
| Metric | No memoization | Manual memoization | React Compiler |
|---|---|---|---|
| Whole-app commits | 1 | 1 | 1 |
| Queue render-work events | 4 | 0 | 0 |
| Row render-work events | 67 | 1 | 67 |
| Open-button render-work events | 67 | 0 | 0 |
| Favorite-button render-work events | 67 | 1 | 1 |
| Row mounts (not update events) | 0 | 0 | 0 |
| Open-button mounts | 0 | 0 | 0 |
| Favorite-button mounts | 0 | 0 | 0 |
search (legacy bulk input)
| Metric | No memoization | Manual memoization | React Compiler |
|---|---|---|---|
| Whole-app commits | 1 | 1 | 1 |
| Queue render-work events | 4 | 0 | 0 |
| Row render-work events | 1 | 0 | 1 |
| Open-button render-work events | 1 | 0 | 0 |
| Favorite-button render-work events | 1 | 0 | 0 |
| Row mounts (not update events) | 0 | 0 | 0 |
| Open-button mounts | 0 | 0 | 0 |
| Favorite-button mounts | 0 | 0 | 0 |
filter status
| Metric | No memoization | Manual memoization | React Compiler |
|---|---|---|---|
| Whole-app commits | 1 | 1 | 1 |
| Queue render-work events | 4 | 0 | 0 |
| Row render-work events | 1 | 0 | 1 |
| Open-button render-work events | 1 | 0 | 0 |
| Favorite-button render-work events | 1 | 0 | 0 |
| Row mounts (not update events) | 0 | 0 | 0 |
| Open-button mounts | 0 | 0 | 0 |
| Favorite-button mounts | 0 | 0 | 0 |
sort and reset
| Metric | No memoization | Manual memoization | React Compiler |
|---|---|---|---|
| Whole-app commits | 4 | 4 | 4 |
| Queue render-work events | 16 | 2 | 4 |
| Row render-work events | 136 | 0 | 136 |
| Open-button render-work events | 136 | 0 | 0 |
| Favorite-button render-work events | 136 | 0 | 0 |
| Row mounts (not update events) | 199 | 199 | 199 |
| Open-button mounts | 199 | 199 | 199 |
| Favorite-button mounts | 199 | 199 | 199 |
resolve incident
| Metric | No memoization | Manual memoization | React Compiler |
|---|---|---|---|
| Whole-app commits | 1 | 1 | 1 |
| Queue render-work events | 4 | 0 | 0 |
| Row render-work events | 200 | 1 | 200 |
| Open-button render-work events | 200 | 0 | 0 |
| Favorite-button render-work events | 200 | 0 | 0 |
| Row mounts (not update events) | 0 | 0 | 0 |
| Open-button mounts | 0 | 0 | 0 |
| Favorite-button mounts | 0 | 0 | 0 |
Favorite interaction: post-GC JS heap (normal builds)
Separate favorite diagnostic, not load-window memory or selection/filtering allocation. The six UPLT contexts at 4x CPU slowdown also sample Performance.JSHeapUsedSize after forced GC at table readiness and after favoriting INC-0001. Medians of six paired runs; GC is outside load/CPU windows. This is renderer JS heap, not total tab/DOM/native memory or a leak test. Full runs remain in comparison.json.
| Metric | No memoization | Manual memoization | React Compiler |
|---|---|---|---|
| Before favorite (MiB) | 4.67 | 4.72 | 5.09 |
| After favorite (MiB) | 6.09 | 5.11 | 5.59 |
| Paired median change (KiB) | 1451.4 | 402.0 | 502.0 |
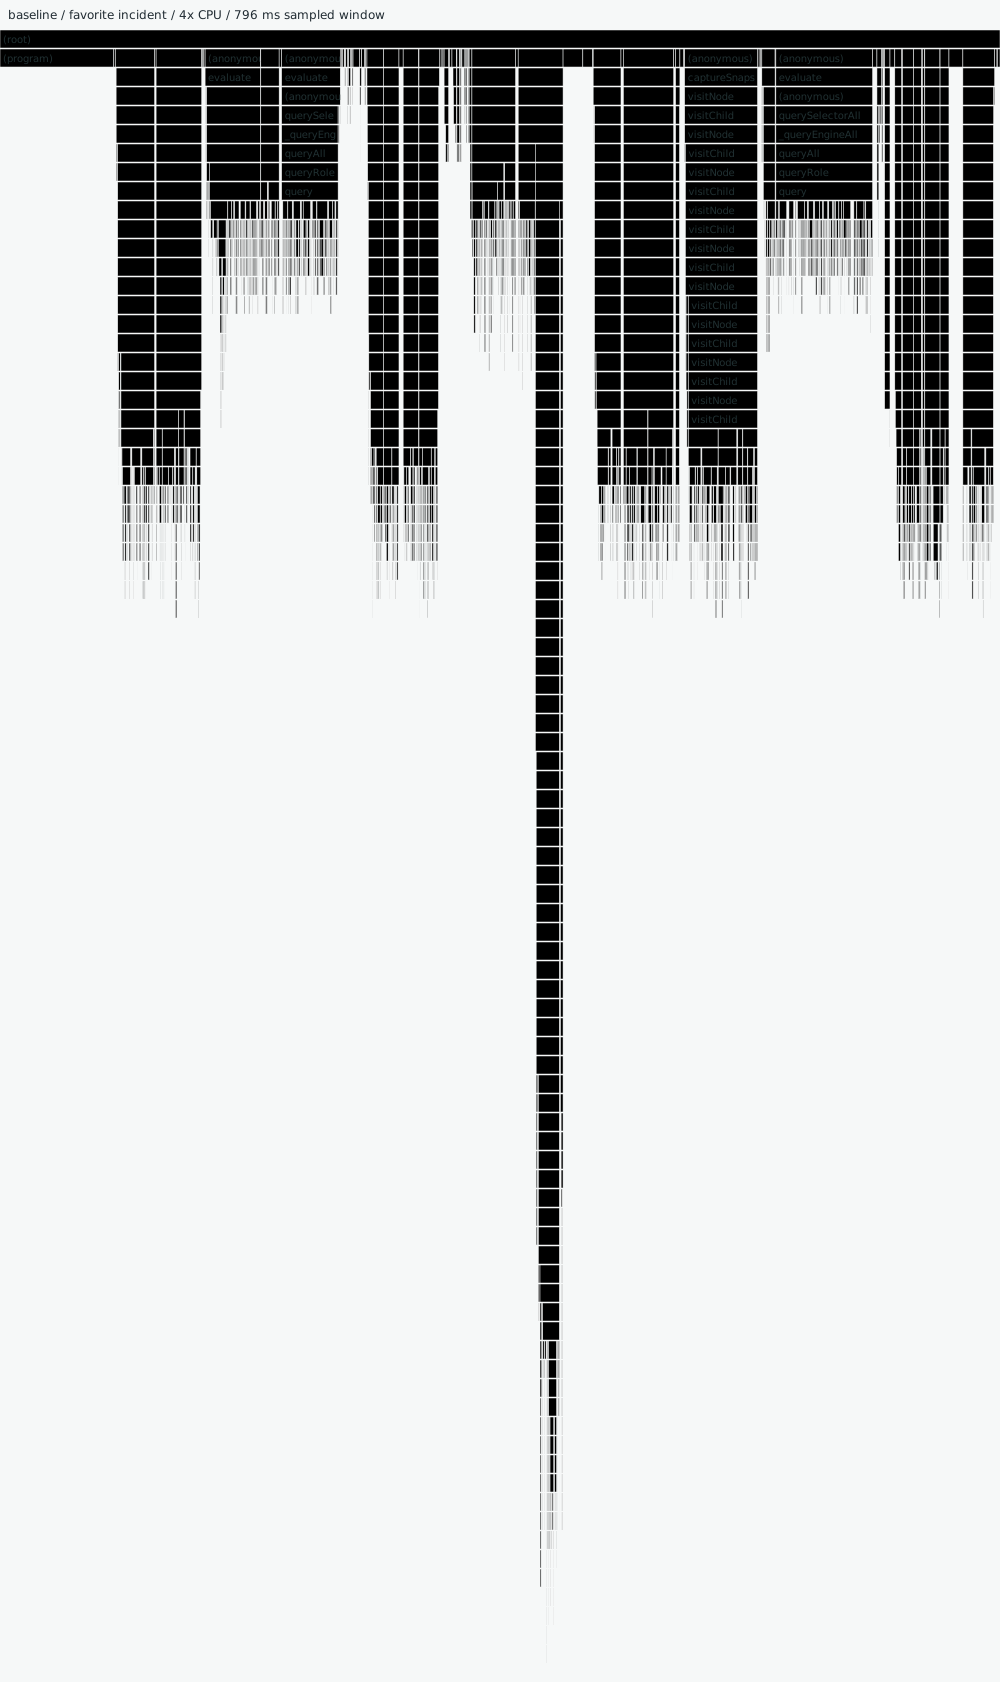
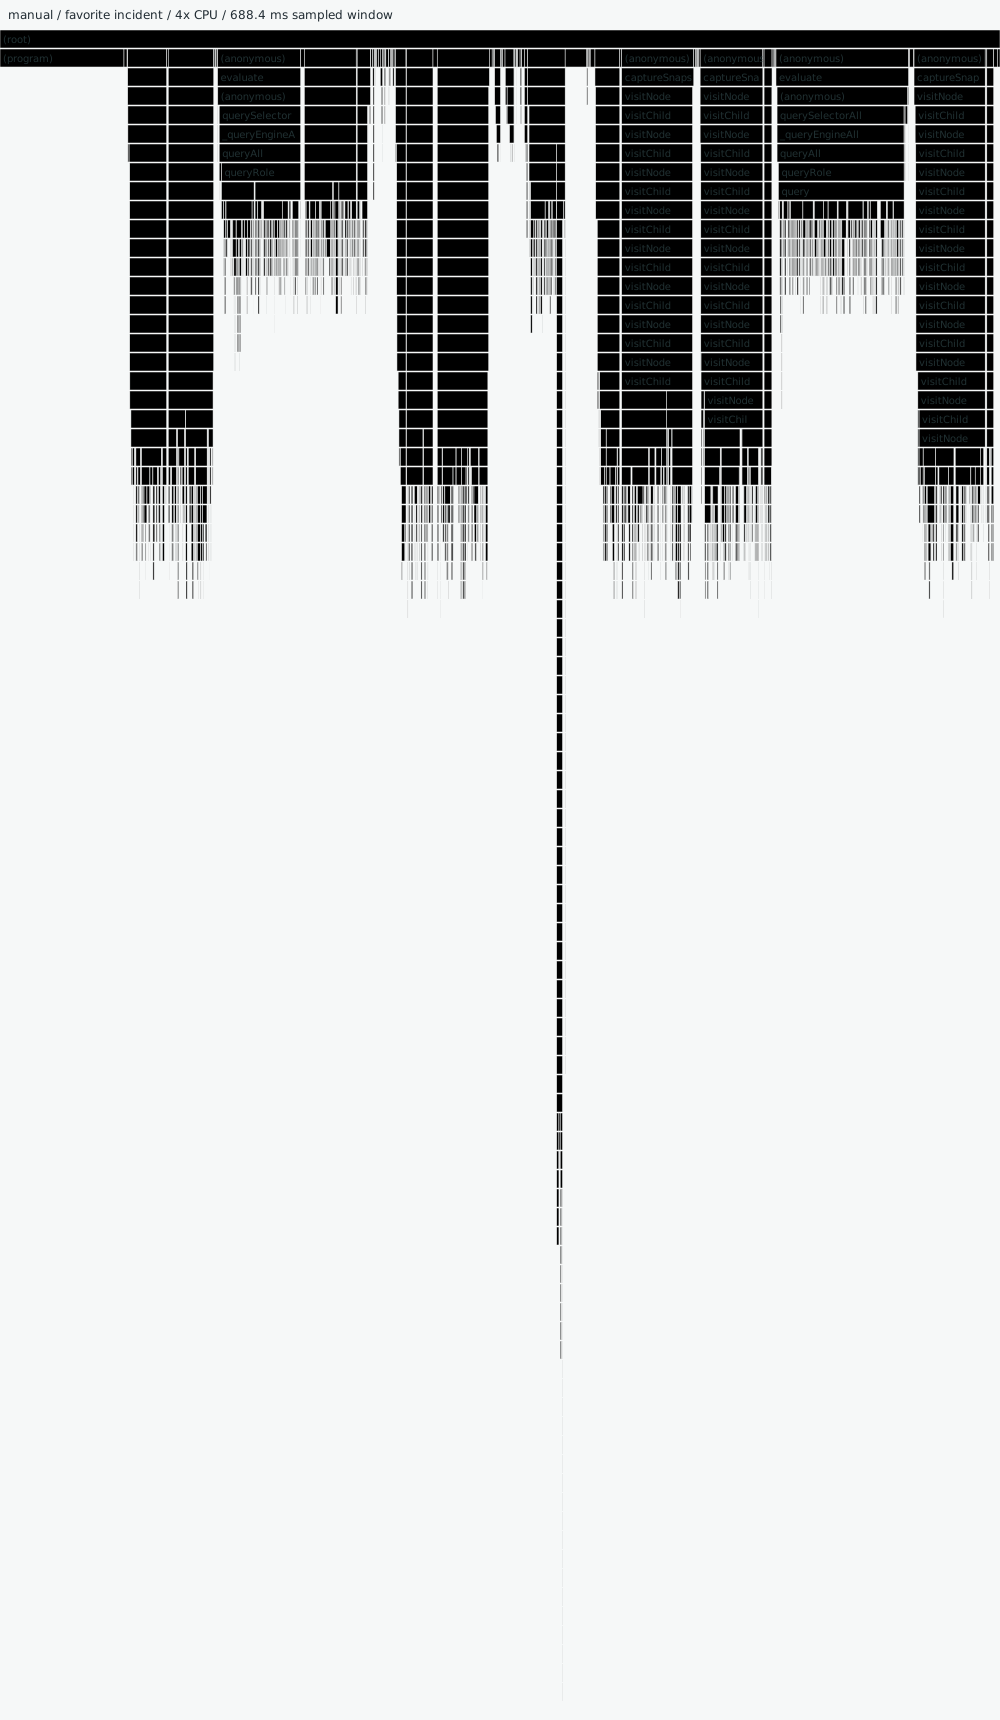
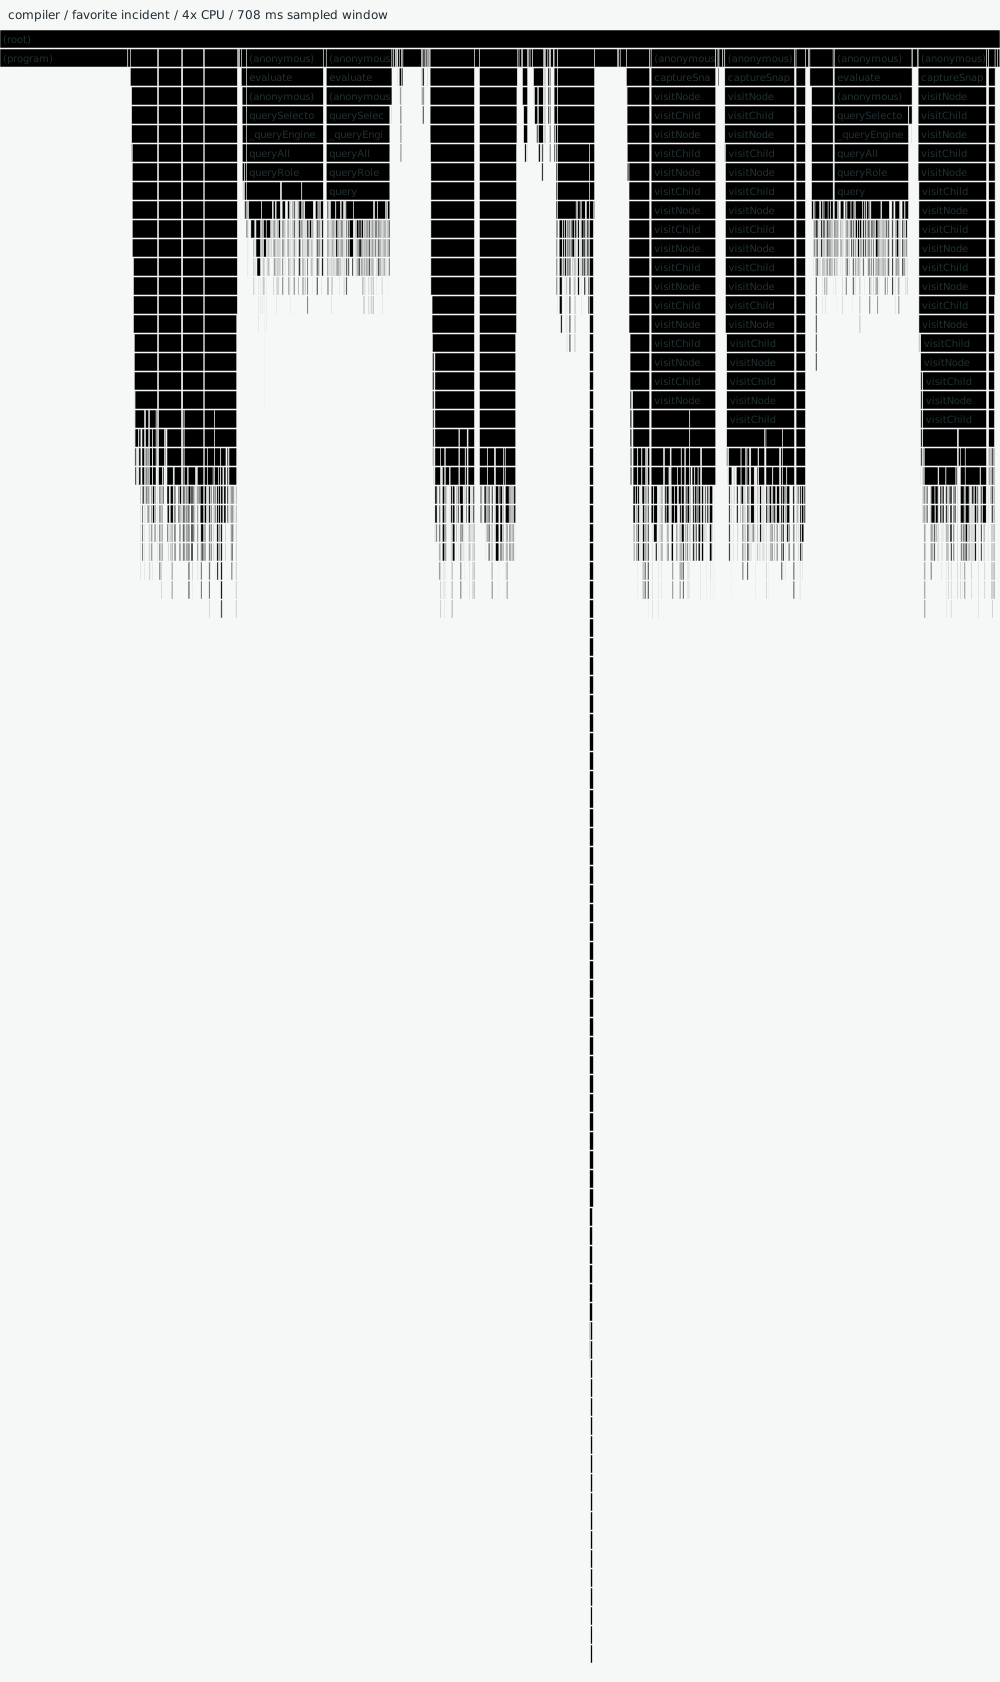
Favorite interaction: CPU slowdown flame charts
One normal-build favorite trace per app at 4x CPU slowdown. JS-active sampled time excludes V8 (idle) and (program). It is an approximate slice of the sampled window, not end-to-end response time or a render count. Captures include Playwright-triggered work and cannot establish a performance winner. Each chart has its own time scale; compare measured values, not chart widths. Raw profiles open in Chrome DevTools.
| Metric | No memoization | Manual memoization | React Compiler |
|---|---|---|---|
| Sampled window (ms) | 796.0 | 688.4 | 708.0 |
| JS-active sampled time (ms) | 639.4 | 543.5 | 546.5 |
| JS-active share (%) | 80.3 | 78.9 | 77.2 |
No memoization (1942 samples)
Open raw No memoization CPU profile
Manual memoization (1653 samples)
Open raw Manual memoization CPU profile
React Compiler (1757 samples)
Open raw React Compiler CPU profile
What the isolated row-memo experiment adds
The three comparison arms remain unchanged. A separate manual-app experiment toggles only the outer IncidentRow memo wrapper; callbacks, provider values and child memoization stay intact. Removing that wrapper does not reproduce compiler caching inside the row, and cannot predict the benefit of adding memo to the compiler arm.
These results match the main report's source fingerprint and runtime versions; the ON arm's initial-load assets are byte-identical to the measured manual build. Timings are from a separate paired experiment, not extra trials pooled into the three-arm selection comparison.
| Action | Row events ON / OFF | Mean paired DOM saving (ms) | 95% interval (ms) | Mean paired frame-opportunity saving (ms) | 95% interval (ms) |
|---|---|---|---|---|---|
| switch queue | 0 / 67 | 3.21 | 0.44 to 5.98 | 3.98 | -3.14 to 11.11 |
| select incident | 1 / 67 | 3.24 | 3.14 to 3.34 | 1.97 | -0.84 to 4.78 |
| favorite incident | 1 / 67 | 2.82 | 2.15 to 3.49 | 1.96 | 0.63 to 3.30 |
Whole-build ON-minus-OFF bundle delta: +12 raw bytes / +1 gzip bytes. This is not the isolated library size of React.memo.
Positive savings are OFF minus ON, favoring memo. Thirty paired trials at 4x CPU throttle are grouped into three fresh-context blocks; exploratory Student-t intervals use the three block means, not 30 independent observations. All blocks share one browser/hardware session, and intervals are unadjusted across endpoints. Spanning zero is inconclusive, not equivalence. Frame opportunity is not actual paint; neither endpoint is INP. No automatic winner or timing gate is inferred.
Full row-memo report · Paired raw measurements · Computed ablation summaries
Methodology
Reading the Profiler durations
A render-work event marks an already-mounted component whose React 19.3.0 profiling fiber records PerformedWork in a completed update. A component may contribute events in multiple commits. Events are not milliseconds, equal-cost CPU operations, DOM mutations, or a complete function-invocation count. Only whole-app commits come from the external root React <Profiler>; nested callbacks do not prove the wrapped component ran. These internal diagnostics are not additive or an API guaranteed across React releases.
Root includes App and provider render bodies; shell, toolbar, list, detail, rows, queue items and buttons are inclusive subtree measurements. Overlapping root/parent/child durations are never summed into a total or treated as component self-time.
ACTUAL (actualDuration) is measured subtree render work. BASE (baseDuration) is React's estimated full-subtree render cost from the most recent measured component costs, not a separately measured unoptimized run. It may retain earlier costs and does not undo useMemo/compiler caches or reconstruct uncached calculation costs. BASE minus ACTUAL is not measured savings. Neither is event-handler, layout, paint or end-to-end interaction time.
Whole-app commits count one external root callback per [rootId, rootGeneration, commitSequence]. Initial mounts are outside action windows; action mounts stay separate from update events. Capture waits for semantic outcomes and completed batches in this synchronous workload, not arbitrary future asynchronous work.
In comparison.json, medianDurationMs (ACTUAL) and medianBaseDurationMs (BASE) are independently computed medians across per-run callback medians, not interaction totals. Mount summaries and raw runs stay separate; null means no matching callback was observed, while 0 is a measured zero. Raw durations and lifecycle identities remain in measurements.json. All Profiler durations include diagnostic overhead and are advisory, never CI timing thresholds. Native profiling is separate from normal-build 4x timings and browser sampling diagnostics.
Versions and provenance
Node v22.23.3; Chromium 145.0.7632.6; React 19.3.0; Vite 8.3.0; plugin-react 6.1.1; oxc-transform-react 0.145.0; Oxlint 1.85.0.
200 deterministic incidents; isolated Chromium contexts; one warm-up and 3 rotated profiling repetitions; 6 UPLT runs covering all app orders; initial mounts outside actions, action mounts reported separately from updates
Source, build and measurement fingerprints bind these observations to one capture. Missing or mismatched evidence fails publication rather than mixing results from different runs.